Open data · since 2019

Understanding the planet through data

Meridian brings climate, energy, cities and the ocean into a set of interactive dashboards and explainers that read without a degree.

24
indicators tracked
12
open datasets
monthly
series refresh
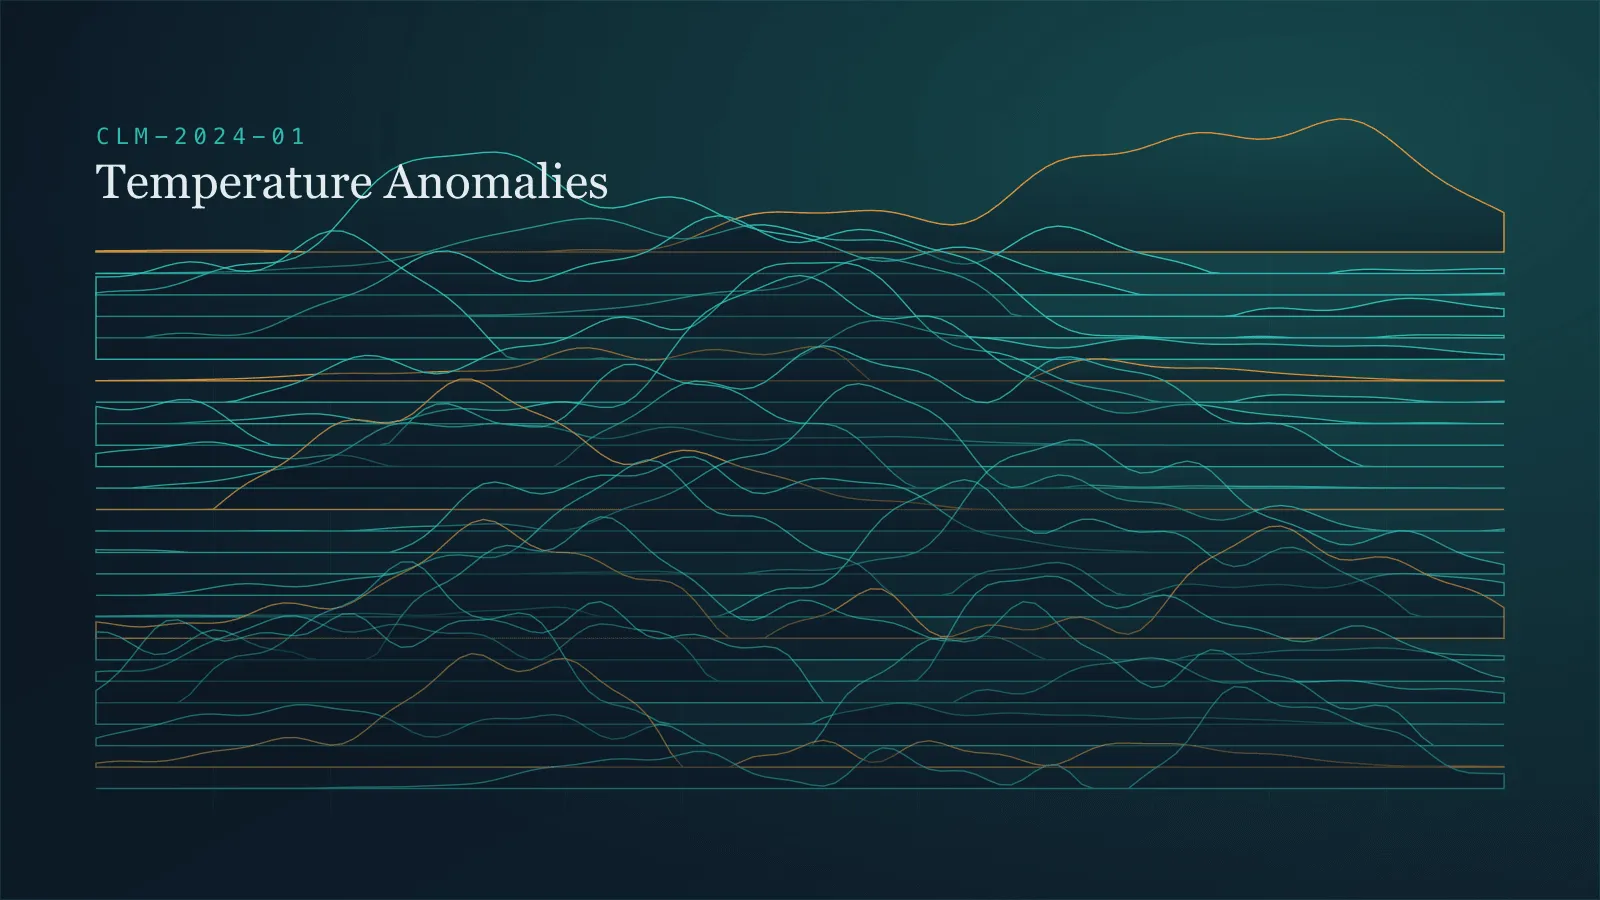
Temperature anomaly, 1975–2024 Source: Meridian · synthetic

Surface-temperature departure from a baseline period. Shading marks the confidence band.

KPI

Headline indicators

A fresh cut from the four thematic panels — with decade-long trends.

+0.31 / 10y
+1.35 °C
Temperature anomaly
vs. baseline
+2.4 / yr
417 ppm
CO₂ concentration
latest month
+3.4 mm / yr
13.4 cm
Sea level
since 1993
+18 / 10y
57%
Renewable share
of generation

Dashboards

Thematic dashboards

Four domains of observation. Each panel is interactive and re-themes itself to match your appearance settings.

All dashboards

Reports

Latest reports

Long reads with methodology, graphics and takeaways — no filler.

All reports

Methodology

Data should be verifiable

Every series is documented in the methodology, exported in open formats and published under a CC BY 4.0 license.

How we measure